A fully featured observability platform delivering scalable log search and correlation, unified monitoring, distributed tracing, and self-service dashboarding - 100 % open-source, zero vendor lock-in.
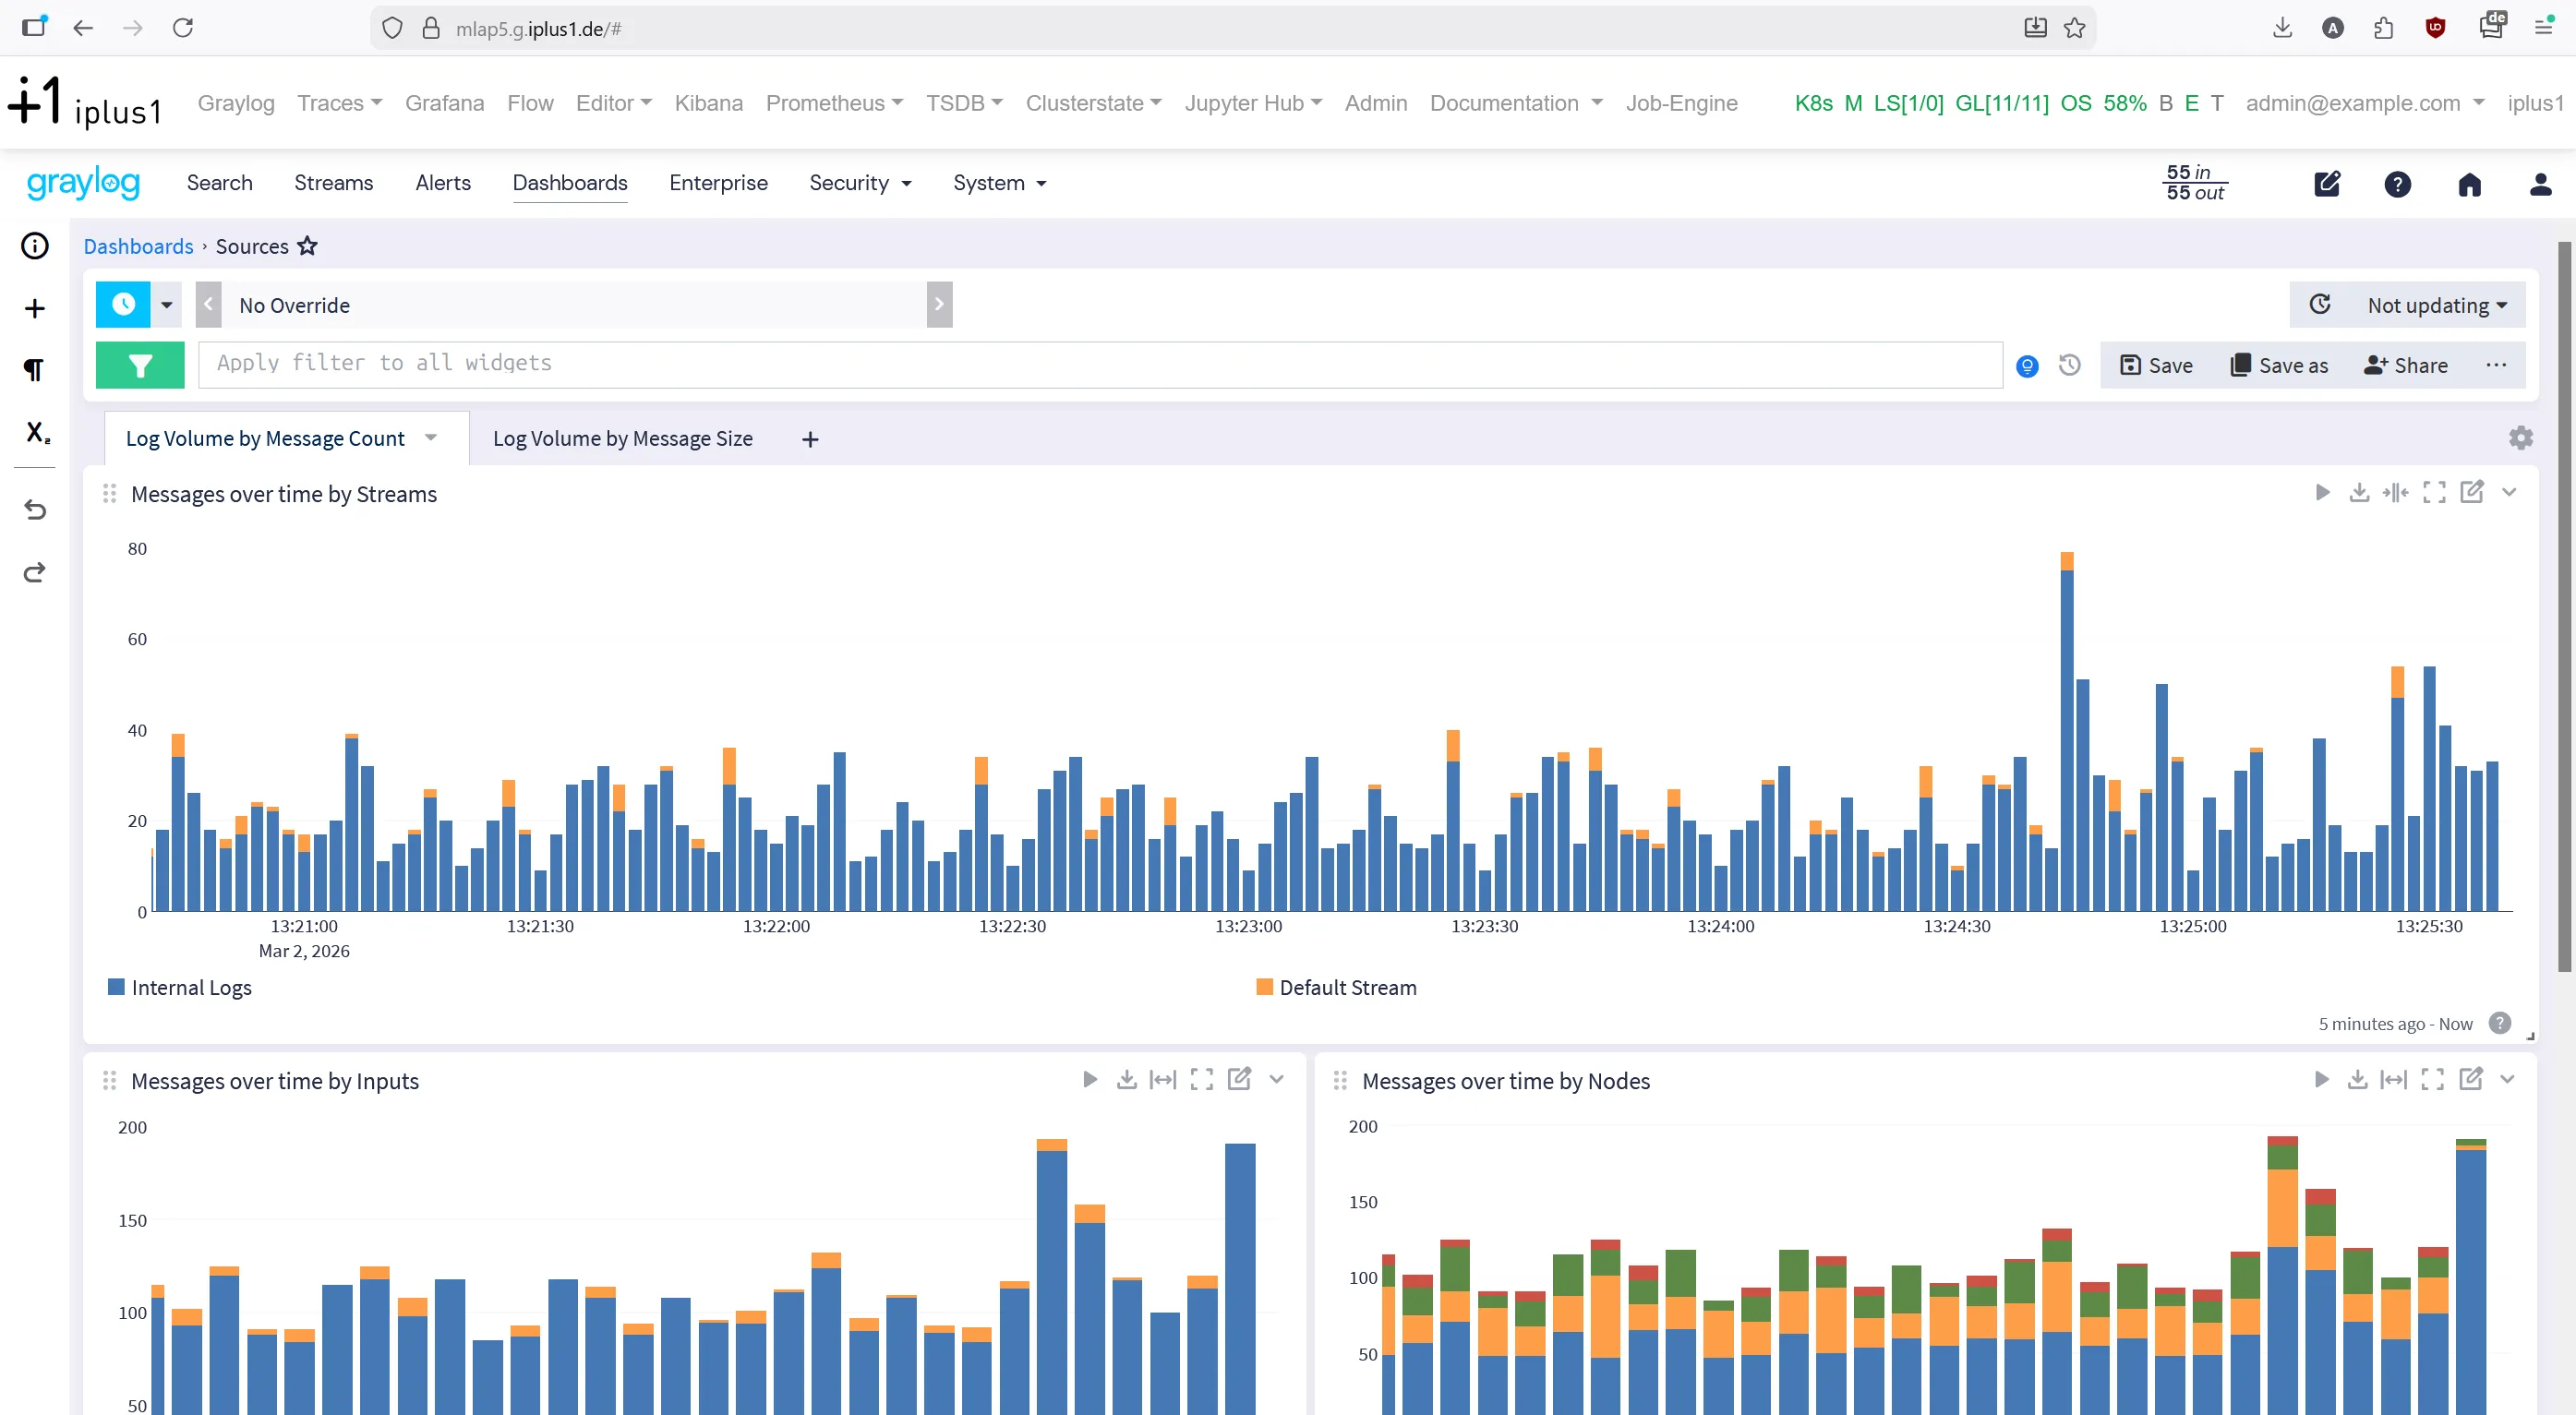
Ingest and query machine logs, IT/telco system logs and access-control events at scale. Powered by OpenSearch and Graylog.
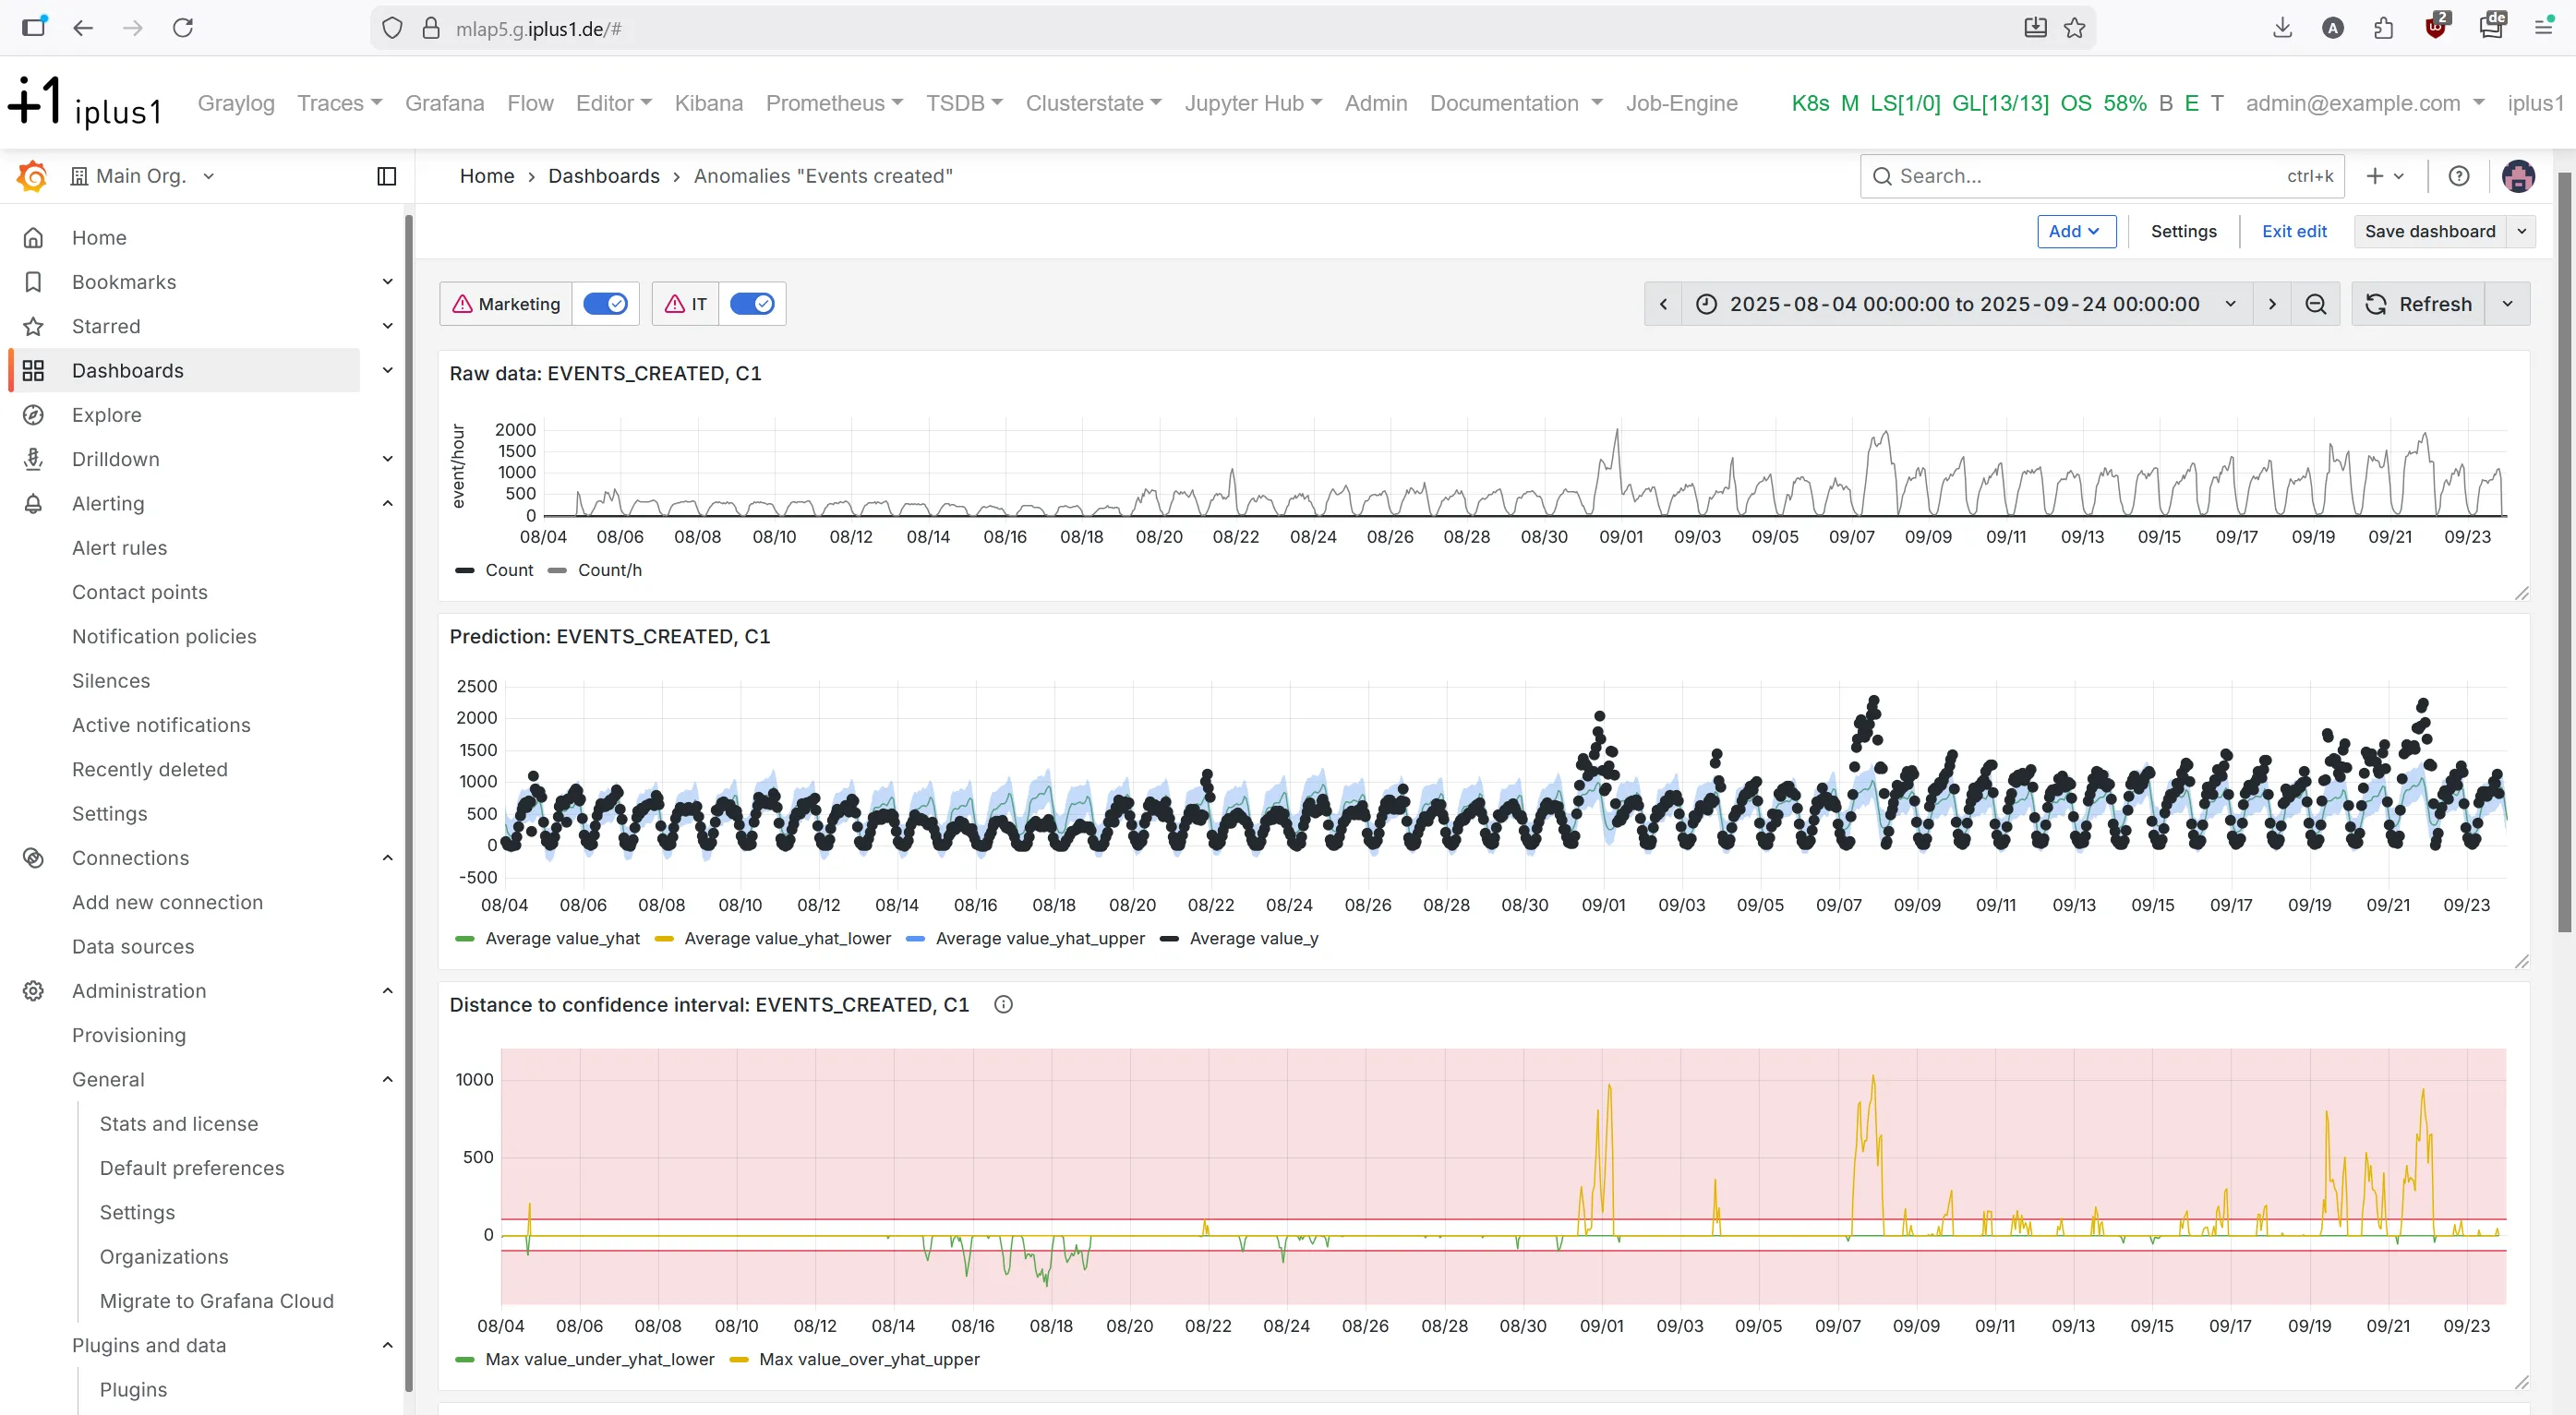
Built-in cluster health, data-source surveillance, and application monitoring with Prometheus and Grafana.
OpenTelemetry-native trace, metric, and log collection. Follow a request across microservices with Jaeger, using spans and sampling.
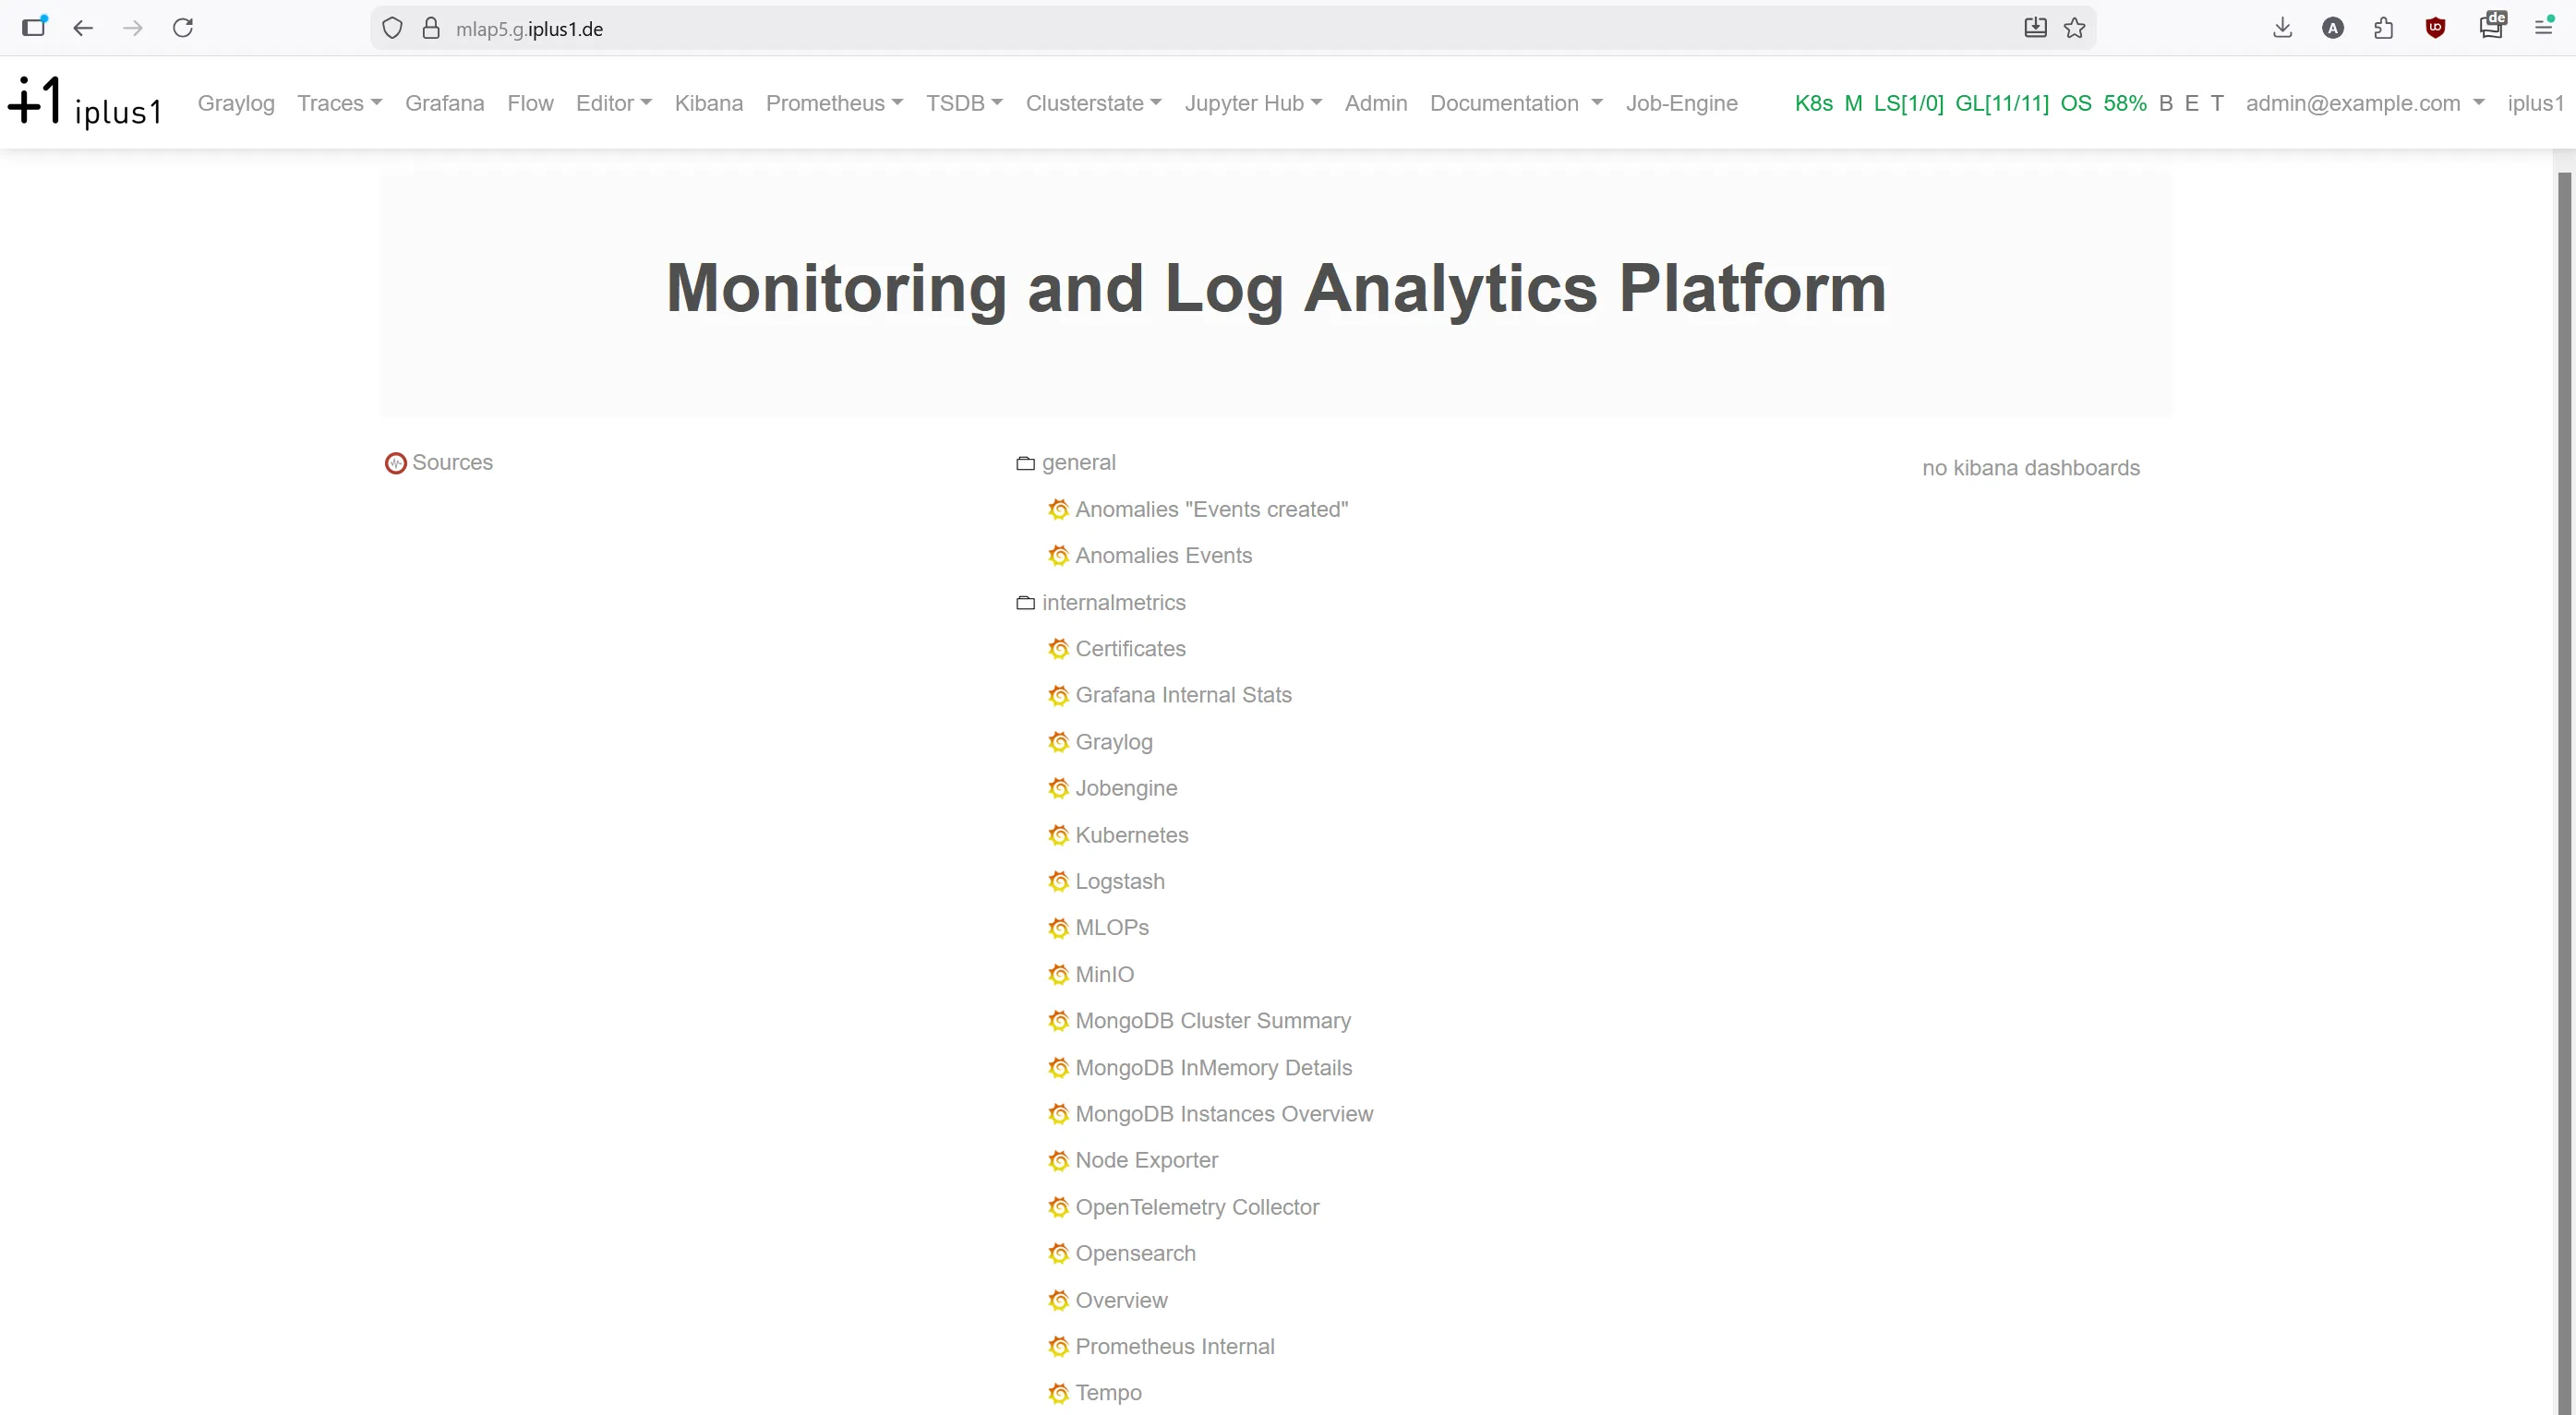
Flexible dashboards with Grafana and Kibana. Connect to existing systems and create custom visualisations without development effort.
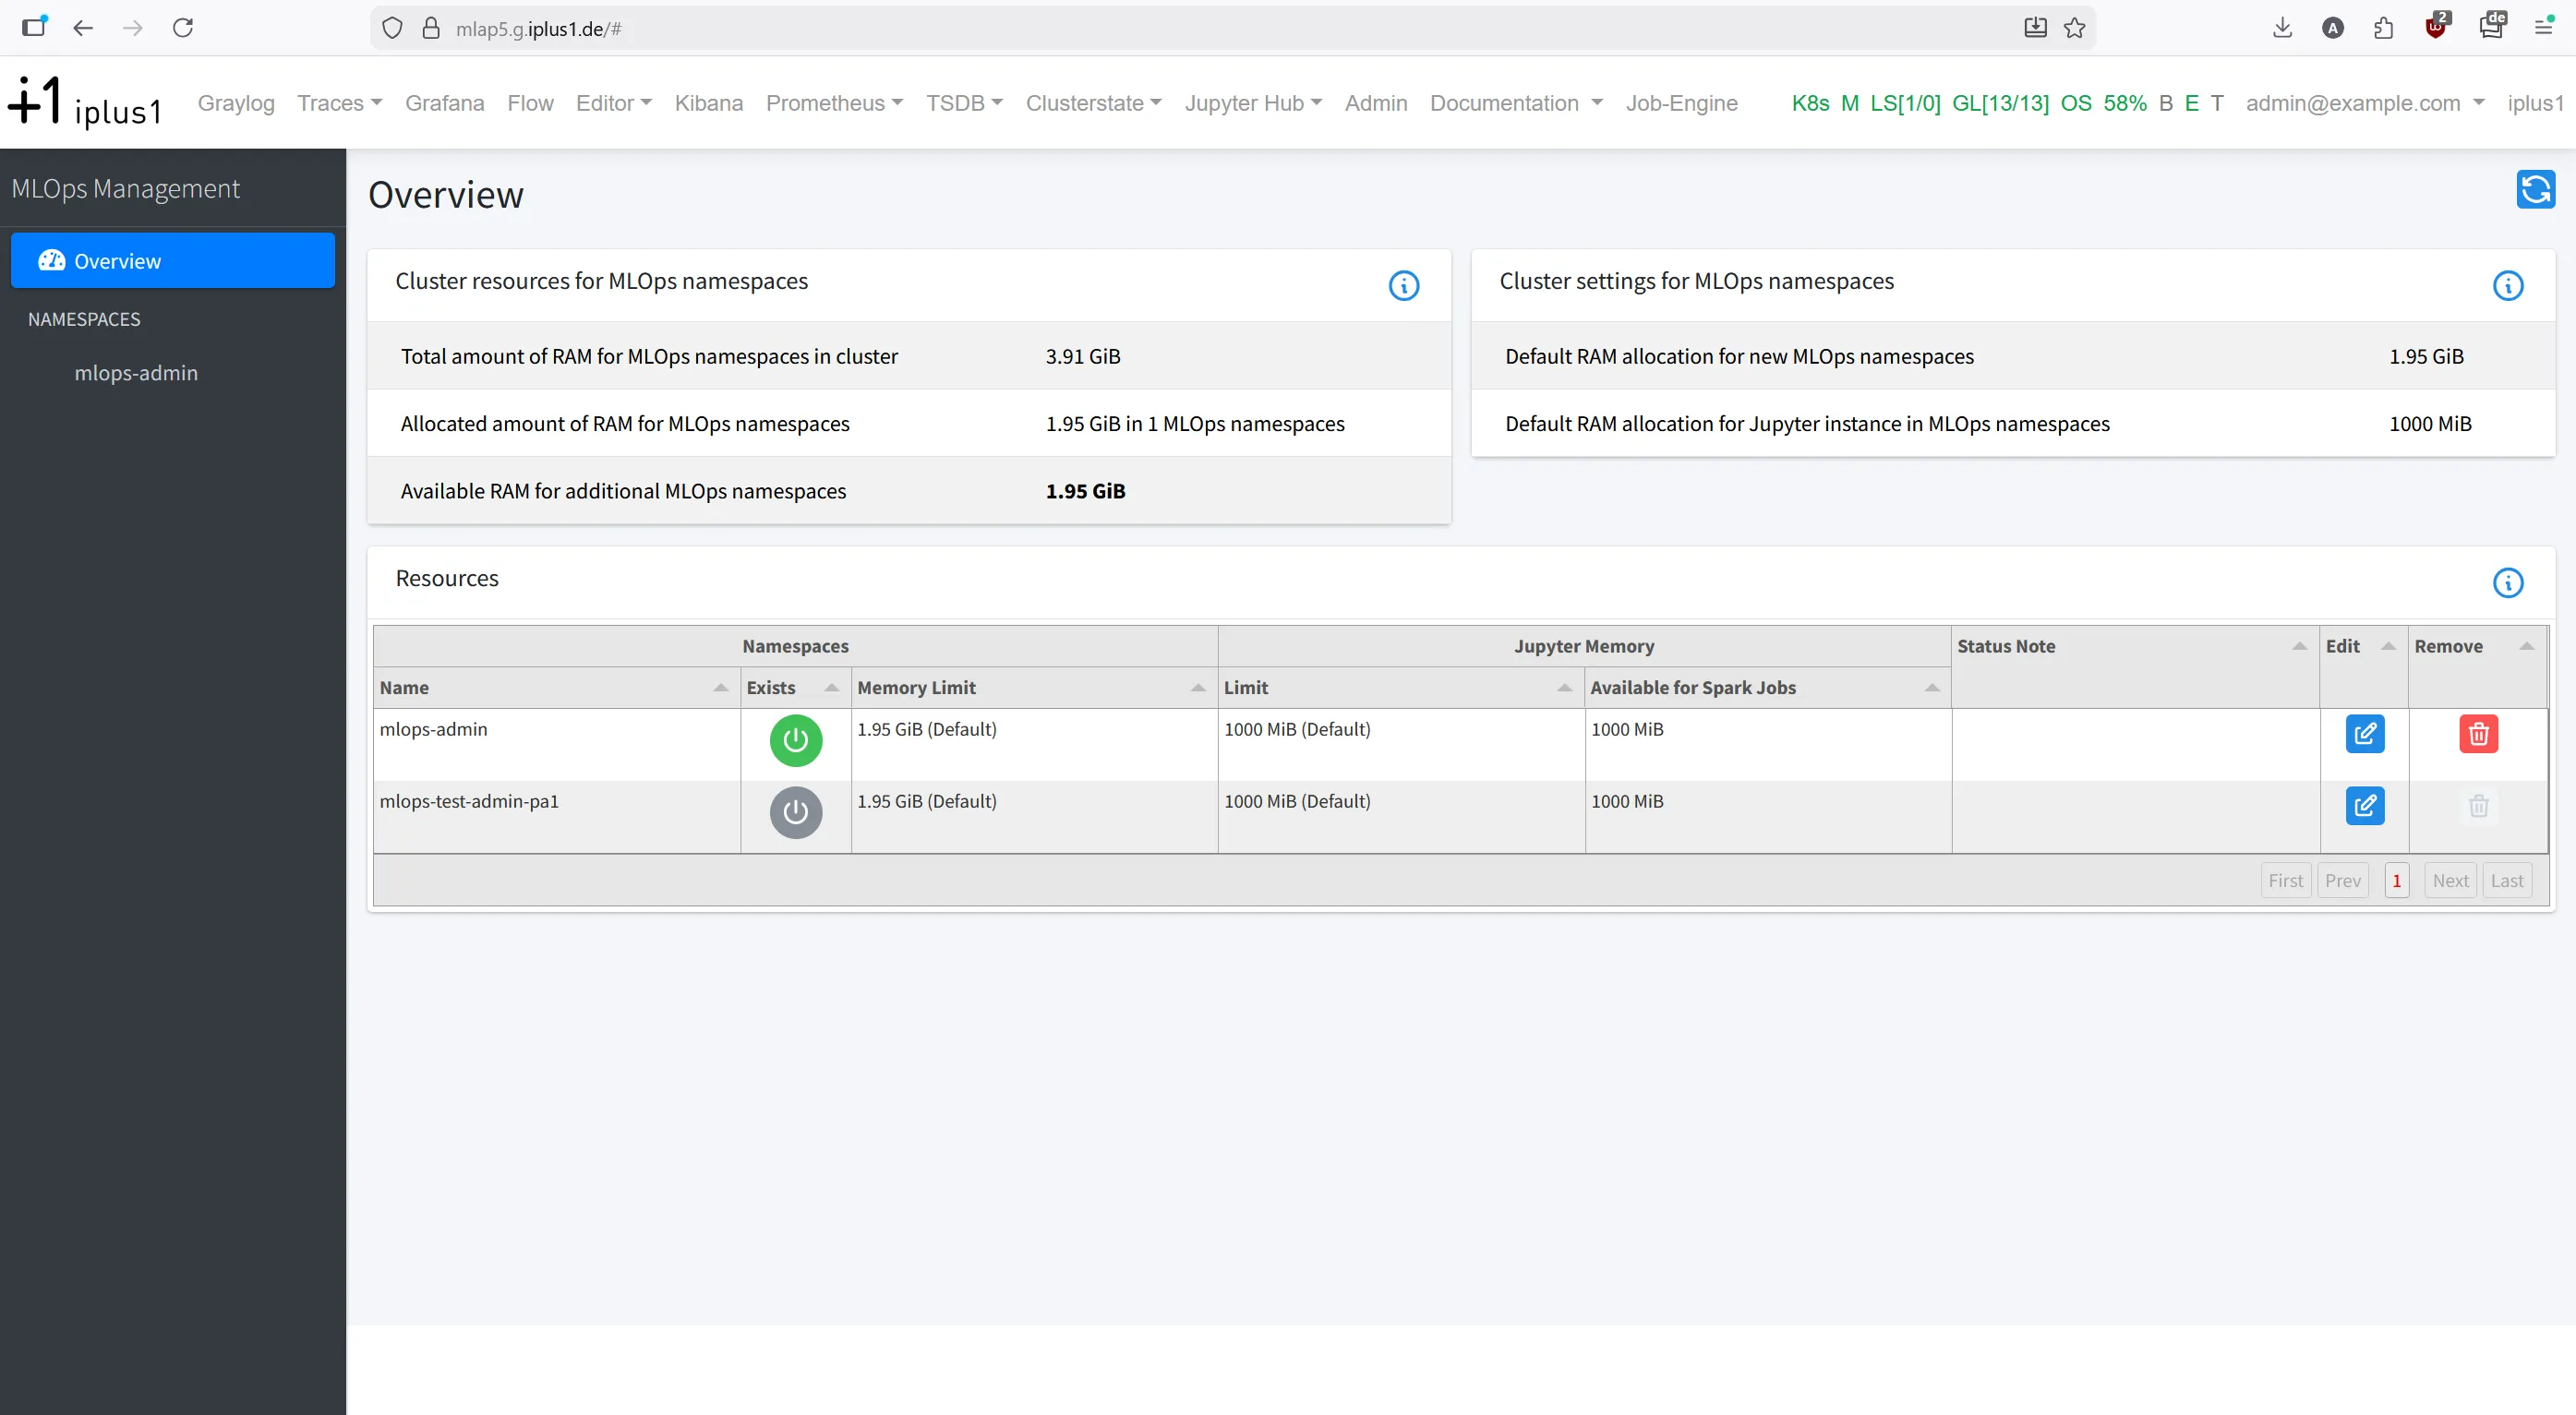
Jupyter with all major open-source libraries for data analytics and data science use cases in Python and more.
All UIs behind one URL. Context broker, device/asset management, and SSO via LDAP, OAuth2 or OpenID Connect (e.g. Keycloak).
No licence fees. No vendor lock-in. Full source-code auditability. iplus1 acts as solution provider, system integrator, and distributor — with consulting and support.
iplus1 operates the platform from a public cloud on your behalf.
iplus1 manages or assists operation in your own data centre — VMs or bare-metal.
You run the platform yourself after know-how transfer and onboarding by iplus1.
iplus1 monitors platform and applications around the clock — proactive issue resolution.
Regular updates, ongoing development, and 2nd/3rd-level support by iplus1.
Fast project start with low risk — thanks to pre-integrated building blocks and proven architecture.
Get in touch