
Building a Resilient OpenTelemetry Log Pipeline
How do I ensure reliable and robust log shipping with OpenTelemetry?
Building a Resilient OpenTelemetry Log Pipeline
End-to-End Backpressure for Reliable Log Delivery
Graylog aggregates and processes log data from distributed systems, making it easy to search, analyze, and troubleshoot system events.
Traditionally, Graylog relies on an agent installed on each source system to collect and forward log data.
In our environment, we use the vendor-neutral OpenTelemetry (OTel) framework to collect, process, and forward telemetry data for system monitoring and observability.
OpenTelemetry defines three primary telemetry signal types:
- Traces capture the path and duration of requests as they travel through distributed systems.
- Metrics provide numerical measurements, such as CPU utilization, memory consumption, or error rates.
- Logs record timestamped events and system messages generated by applications and infrastructure.
Using the OpenTelemetry Agent for log collection provides an additional benefit: the same agent can also collect metrics and traces, eliminating the need to deploy and manage multiple data collection agents.
OpenTelemetry Agents and Collectors provide a resilient telemetry pipeline by supporting batching, queuing, retries, and load balancing, improving delivery reliability.
The central OpenTelemetry Collector aggregates data from multiple Agents and provides a single layer for managing backend connectivity, routing, load distribution, and processing policies before forwarding the data to Graylog.
This article focuses on the log processing pipeline, explaining how logs are collected by OpenTelemetry Agents, processed through the telemetry pipeline, and ultimately delivered to a clustered Graylog backend.
The Problem: Sticky Connections and Uneven Load
To handle larger log volumes, Graylog can run as a horizontally scalable cluster and be extended with additional nodes when needed. Multiple agents send logs to the cluster, which is expected to distribute incoming traffic evenly across its nodes. In practice, transport-level behavior can make this more complicated.
The problem occurs when agents send data over long-lived TCP connections. Traffic may stay attached to the same backend instance for an extended period. If one agent generates significantly more logs than others, this can overload a single Graylog node while the other nodes remain mostly idle.
An overloaded node buffers data until its limit is exceeded, causing messages to be dropped even though the cluster still has unused capacity.
The key issue is flow control, not just throughput.
A reliable log pipeline must handle both high-throughput delivery during normal operation and slowdowns or temporary outages when part of the system is under pressure.
The Solution: End-to-End Backpressure
Adding more Graylog nodes can increase capacity, but it does not solve sticky connections by itself. A busy agent can still overload a single Graylog node if most of its traffic stays on the same long-lived connection.
End-to-end backpressure lets the pipeline react to this situation. When Graylog slows down, receiver-side exports slow down and data starts buffering in the receiver queue. If the receiver also comes under pressure, agents should buffer locally or slow down as well. Without backpressure, upstream components may keep sending data while memory, queues, or journals fill up. With backpressure, the pipeline slows down before it fails. Latency may increase, but the system remains controlled.
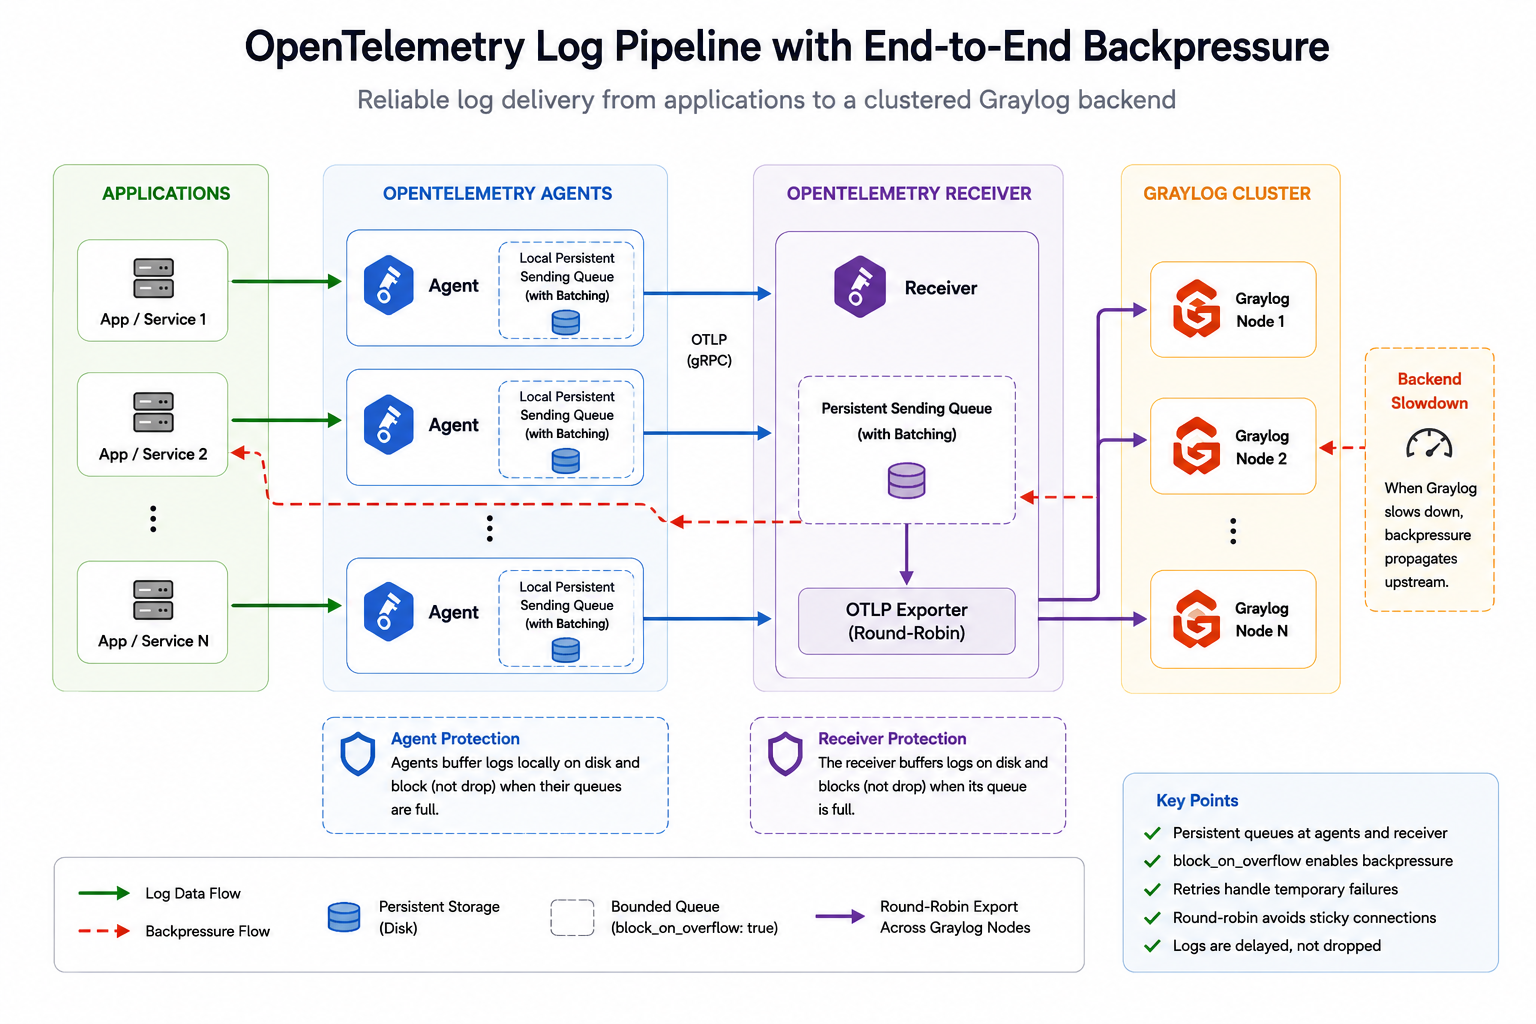
Figure 1: OpenTelemetry log pipeline with end-to-end backpressure. Agents buffer logs locally, the receiver uses a persistent queue, and exports are distributed across Graylog nodes while backpressure can propagate upstream.
The flow can be summarized as follows:
Graylog slows down
    ↓
Receiver-side exports slow down
    ↓
Receiver queue starts to fill
    ↓
Agents slow down or buffer locally
    ↓
The pipeline remains under control
How Backpressure Works in a Log Pipeline
Backpressure is not a single setting. It is the combined effect of several components working together.
When Graylog ingests logs more slowly, receiver-side exports are delayed and queues start to grow. As pressure increases, agents may also buffer data locally, retry exports, or slow down the flow instead of dropping logs immediately.
Backend slowdown
    ↓
Receiver export delay
    ↓
Receiver queue growth
    ↓
Agent export delay
    ↓
Agent queue growth
    ↓
Controlled slowdown instead of immediate data loss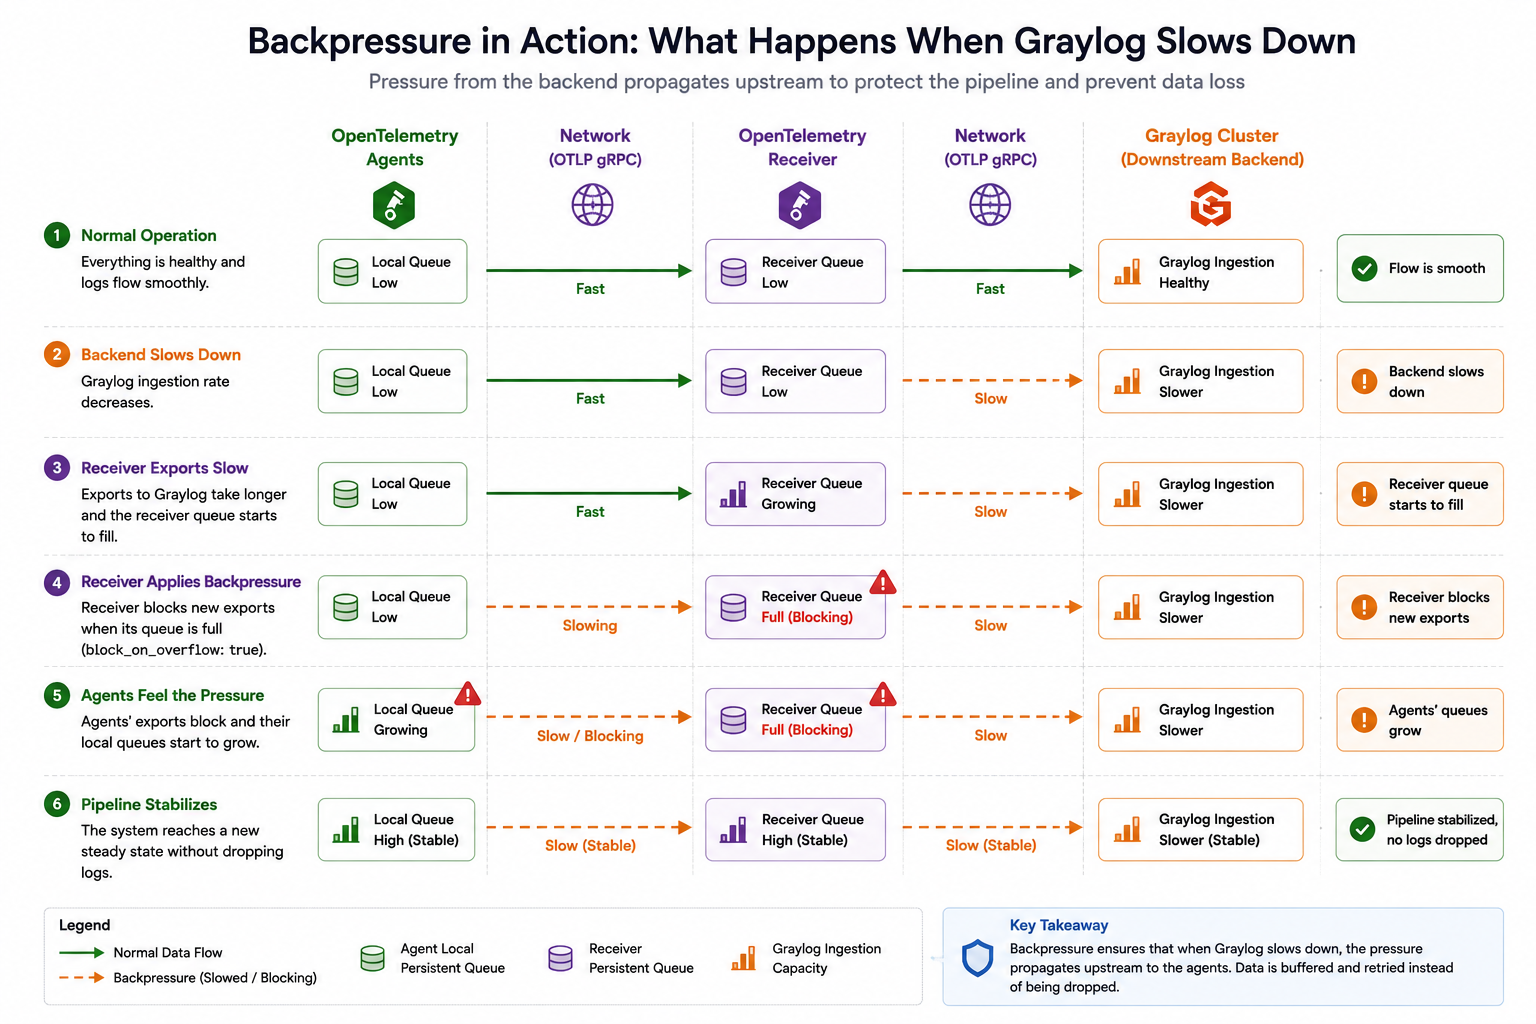
Figure 2: Backpressure behavior during a backend slowdown. Pressure propagates from Graylog to the receiver and then to the agents.
Building the Pipeline: Key Components
In practice, backpressure relies on a few standard OpenTelemetry mechanisms:
-
Sending queues buffer data when the downstream component cannot receive it immediately. Persistent queues store queued data on disk instead of only in memory. When
block_on_overflowis enabled, a full queue blocks instead of dropping data immediately. -
Batching groups multiple log records before export to reduce transport overhead. In this configuration, batching is handled directly by the exporter’s sending queue rather than by a separate batch processor. Batch sizes should be tuned so retries or failures do not affect too many records at once.
-
Retry handling sends data again after temporary failures. Retry intervals should avoid adding more pressure to an overloaded backend.
-
Timeouts define when an export attempt is considered failed and should move into the retry path.
-
Load balancing distributes outgoing traffic across multiple backend instances and helps reduce uneven load caused by long-lived connections.
Configuring Backpressure
In this pipeline, backpressure mainly depends on two settings:
- Persistent queues
- Blocking behavior when queues are full
A persistent queue gives the collector a disk-backed buffer when the downstream component is slower or temporarily unavailable. The storage directory must be placed on durable storage; otherwise, the queue is only as durable as the local filesystem it uses.
block_on_overflow connects the queue to the backpressure chain. When the queue is full, the collector blocks instead of dropping data immediately.
The configuration examples below show the important parts of the configuration, not a complete deployment manifest. Values depend on traffic volume, backend capacity, disk size, and acceptable latency.
Agent
extensions:
  file_storage:
    directory: /var/lib/otelcol/file_storage

receivers:
  filelog:
    include:
      - /var/log/example/*.log
    storage: file_storage
    retry_on_failure:
      enabled: true

exporters:
  otlp:
    endpoint: otel-receiver:4317
    timeout: 30s

    sending_queue:
      enabled: true
      sizer: items
      queue_size: 50000
      batch:
        sizer: items
        flush_timeout: 100ms
        min_size: 400
        max_size: 2000

      # Parallel workers exporting data to the OpenTelemetry Receiver.
      num_consumers: 8

      # Blocks instead of dropping data when the queue is full.
      block_on_overflow: true

      storage: file_storage

    retry_on_failure:
      enabled: true
      initial_interval: 15s
      max_interval: 30s
      max_elapsed_time: 24h

service:
  extensions: [file_storage]

  pipelines:
    logs:
      receivers: [filelog]
      exporters: [otlp]
Receiver
extensions:
  file_storage:
    directory: /var/lib/otelcol/file_storage

receivers:
  otlp:
    protocols:
      grpc:
        endpoint: 0.0.0.0:4317

exporters:
  otlp/graylog:
    endpoint: graylog:4317

    # Uses round-robin balancing when the endpoint resolves to multiple backend addresses.
    balancer_name: round_robin

    timeout: 30s

    sending_queue:
      enabled: true
      sizer: items
      queue_size: 50000
      batch:
        sizer: items
        flush_timeout: 100ms
        min_size: 400
        max_size: 2000
      storage: file_storage
      block_on_overflow: true

      # Parallel workers exporting data to Graylog.
      num_consumers: 16

    retry_on_failure:
      enabled: true
      initial_interval: 15s
      max_interval: 30s
      max_elapsed_time: 24h

service:
  extensions: [file_storage]

  pipelines:
    logs:
      receivers: [otlp]
      exporters: [otlp/graylog]
Supporting Options
Some settings do not create backpressure directly, but they can make the pipeline more stable and predictable.
| Option | Where it applies | Why it helps |
|---|---|---|
keepalive | OTLP exporters from agent to receiver and from receiver to Graylog. Server-side keepalive can also be configured on the receiver’s OTLP/gRPC input. | Helps detect unhealthy long-lived gRPC connections earlier. It does not replace queues, retries, or block_on_overflow. |
memory_limiter | Collector processor, usually configured as the first processor in the pipeline. | Protects the collector process from excessive memory usage. To activate it, it must be added to the pipeline, for example processors: [memory_limiter]. |
max_concurrent_streams | Receiver OTLP/gRPC input. | Limits the number of concurrent gRPC streams the receiver accepts. This can help keep receiver behavior predictable under load. |
max_recv_msg_size_mib | Receiver OTLP/gRPC input. | Defines the maximum accepted gRPC message size. This is a safety limit, not a backpressure mechanism. |
These options are useful safeguards, but the main backpressure behavior still comes from bounded persistent queues, retry handling, and blocking on queue overflow.
Monitor Pipeline Processing
The pipeline must be monitored to understand whether data is flowing normally, buffering, retrying, or approaching capacity limits.
Metric names and labels can vary depending on the OpenTelemetry Collector version, Prometheus exporter settings, and scrape configuration. In some environments, filters such as job, pod, namespace, or instance may need to be adjusted.
The examples below assume that the Collector exposes its internal metrics through the Prometheus exporter.
Log ingestion rate
This shows whether logs are still entering the pipeline.
rate(otelcol_receiver_accepted_log_records_total{instance=~"your-otel-agent.*"}[1m])Log export rate
This shows whether logs are still leaving the pipeline toward the downstream destination.
rate(otelcol_exporter_sent_log_records_total{instance=~"your-otel-receiver.*"}[1m])Queue utilization
This is the most important signal for backpressure. If queue utilization keeps increasing, the downstream destination is not keeping up.
otelcol_exporter_queue_size{instance=~"your-otel-.*"} / otelcol_exporter_queue_capacity{instance=~"your-otel-.*"}Failed export attempts
This shows failed attempts to send log records downstream. It does not necessarily mean data was lost, because retries may still deliver the logs later.
increase(otelcol_exporter_send_failed_log_records_total{instance=~"your-otel-.*"}[5m])Backend pressure
Collector metrics should be combined with backend metrics. For Graylog, useful signals include:
- journal utilization
- journal growth rate
- input rate per Graylog node
- traffic distribution across Graylog nodes
These signals are usually enough to answer the main operational questions: Are logs still moving? Is data accumulating? Is one backend node overloaded? Are queues or journals close to exhaustion?
The following charts show two typical metrics: Graylog journal utilization and receiver queue utilization.
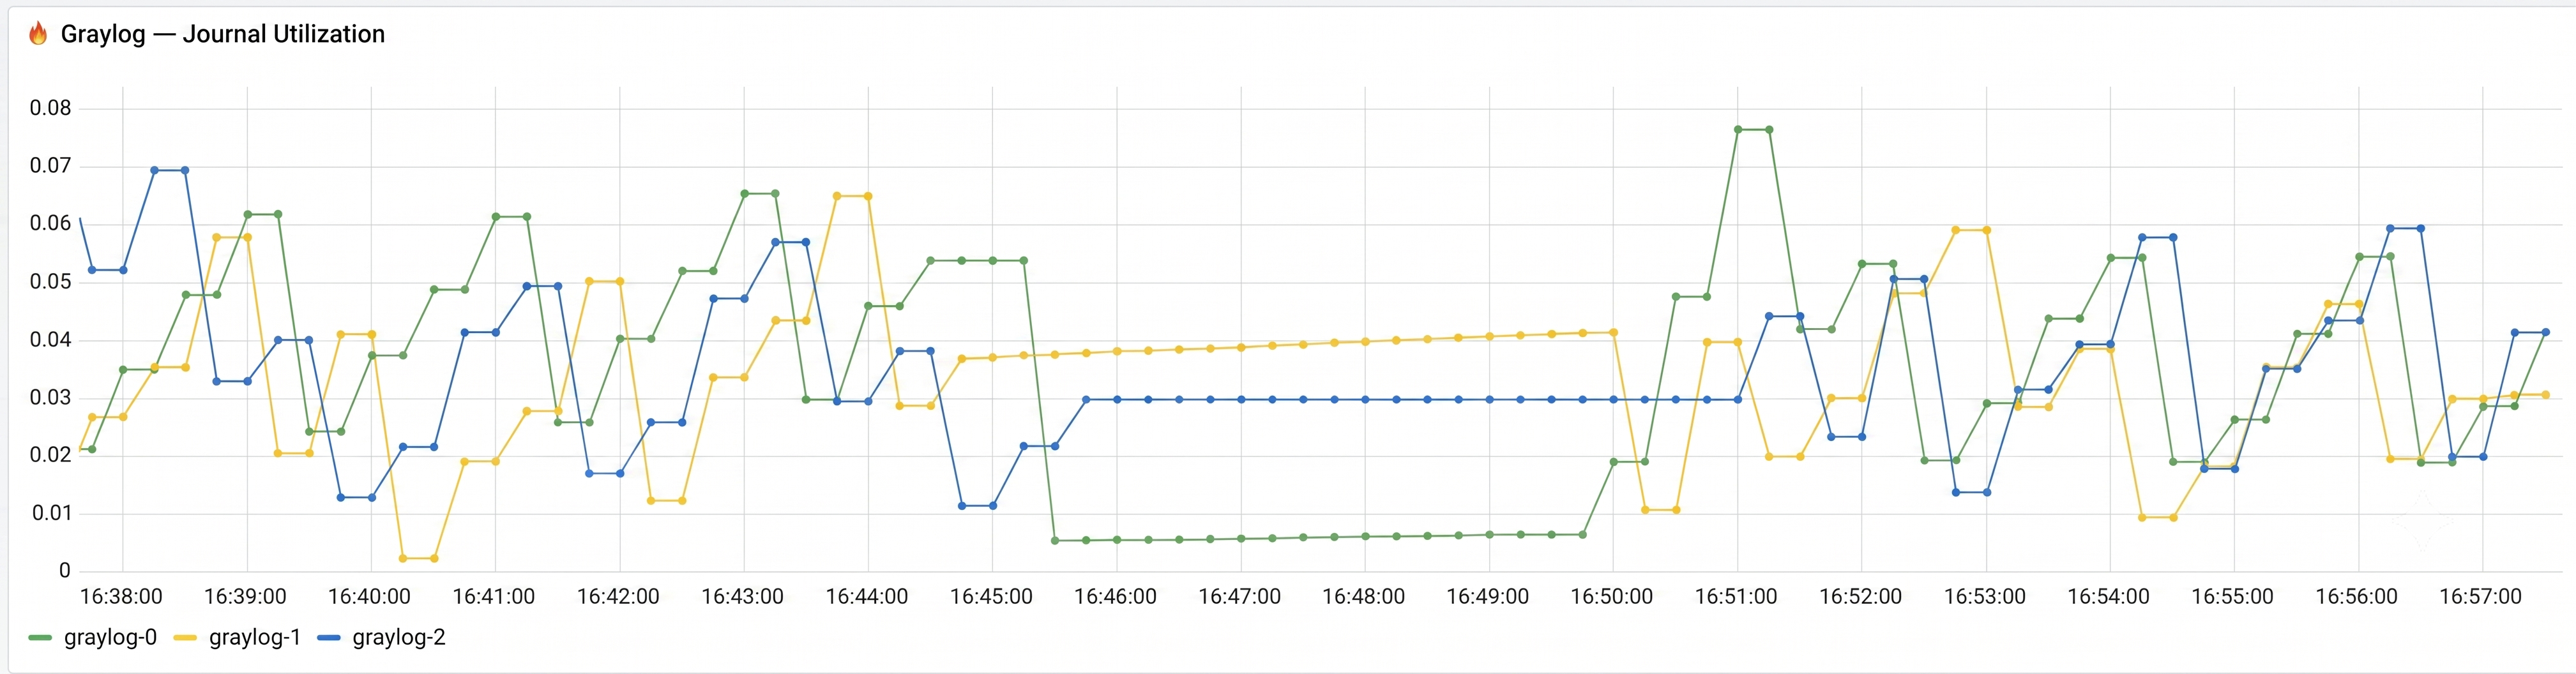
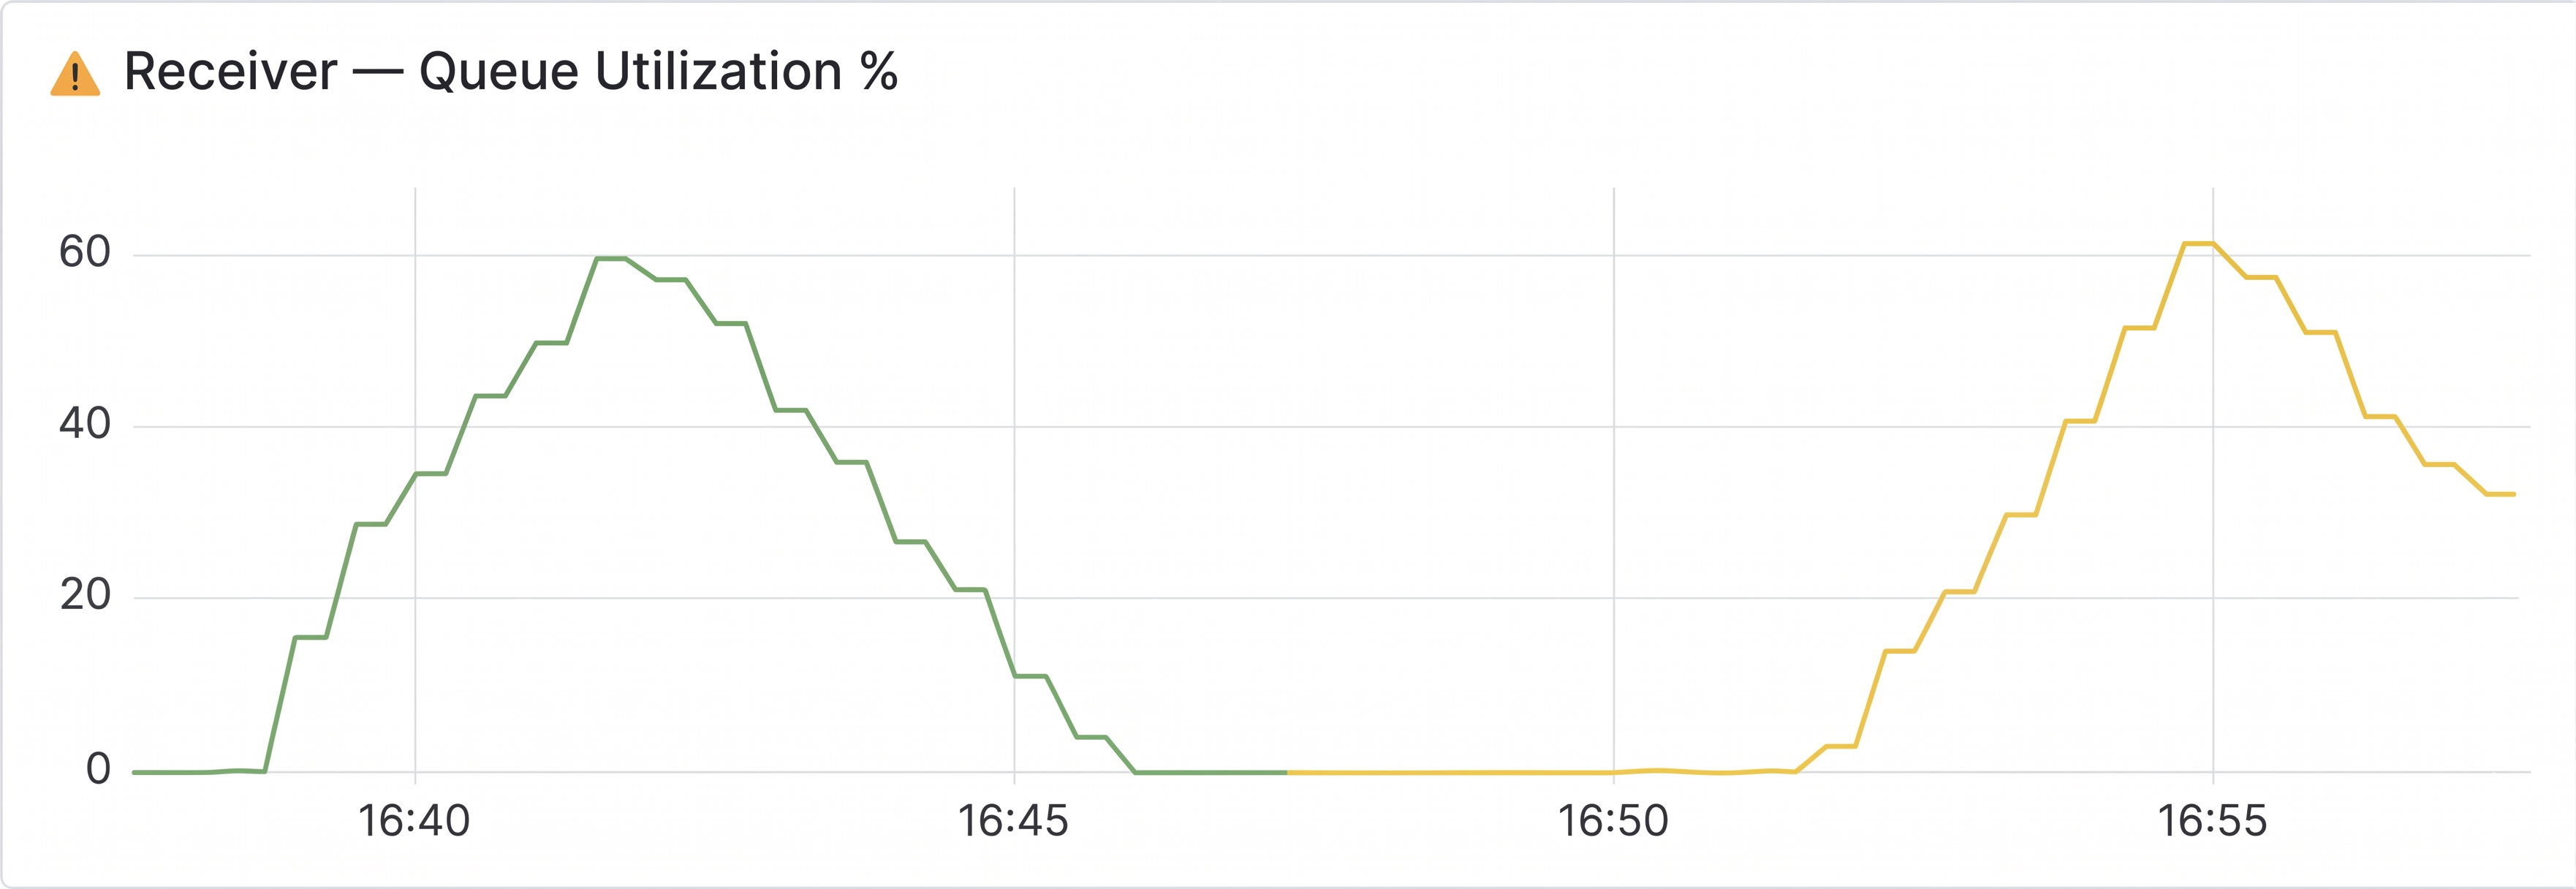
Figure 3: Example monitoring metrics for the log pipeline. Graylog journal utilization helps detect backend pressure and uneven load across Graylog nodes. Receiver queue utilization shows when data is accumulating inside the pipeline.
Trade-offs and Limitations
This architecture improves reliability during temporary slowdowns, but it does not provide unlimited buffering capacity.
Persistent queues, retries, and backpressure give the pipeline time to recover when the backend is slow or briefly unavailable. However, if the incoming log rate stays higher than the Graylog cluster can ingest for a long time, queues will eventually fill up.
There are also a few trade-offs to keep in mind:
- Higher latency during pressure: When the downstream destination slows down, logs may stay longer in queues before they are delivered.
- Additional disk usage: Persistent queues need local disk space. Queue size and disk capacity must be planned together.
- Possible duplicate logs: Retries can lead to duplicate delivery in some failure scenarios. This is a typical
at-least-oncedelivery trade-off; in log management, duplicate records are often preferred over silent data loss, but downstream systems should be able to tolerate them. - Configuration depends on the environment: Queue sizes, batch sizes, retry intervals, and timeouts should be tuned based on real traffic volume and backend capacity.
Backpressure is not a replacement for capacity planning. It is a way to make overload visible earlier and easier to control.
Conclusion
A reliable log pipeline is not only about collecting logs and forwarding them downstream. It must also remain predictable when traffic becomes uneven, queues start to grow, or backend nodes come under pressure.
Sticky long-lived connections can overload one Graylog node while others still have available capacity. End-to-end backpressure changes how the pipeline reacts: agents and receivers can buffer data, retry exports, distribute traffic, and slow down instead of continuing at the same rate until something fails.
Backpressure does not replace capacity planning, monitoring, or careful tuning. Logs may be delayed, but pressure becomes visible earlier and operators get more time to react before queues and journals are exhausted.